Mapping broadband speed and ultrafast availability
Oliver O’Brien, Senior Research Associate at University College London (UCL), discusses the Broadband Speed and Ultrafast Availability data shown on CDRC’s interactive mapping website.
The ESRC Consumer Data Research Centre (CDRC) was set up in 2015, focussing initially on building an open data portfolio, along with a catalogue of secure retail and consumer datasets. As part of this, CDRC were keen to take the many government datasets being published with fine-grained spatial references and improve their accessibility by mapping them. These are published at CDRC Mapmaker, which is a demonstrator of the capabilities of CDRC and the kinds of datasets that CDRC study and visualise.
What story does this visualisation tell, and why was it created?
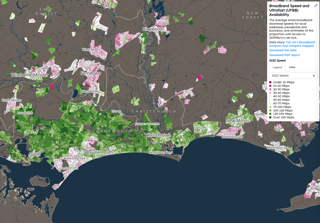
"The Broadband Speed and Availability maps illustrate the variation in access to high-speed broadband for residential and business premises across the UK, as well as the improvements (or lack thereof) in average speeds and superfast access over the past few years. It takes data from Ofcom's (Office for Communications, the regulator of UK broadband provision) Connected Nation reports and places it on a set of interactive maps, bringing the data to life.
"The reports focus on coverage and performance of fixed broadband and mobile networks, with the aim of charting the UK’s evolving communications infrastructure, to progress towards increasing connectivity across the UK.
"The variables mapped are average wired speed and availability of ultra-fast broadband (300Mbps+). The selectable timescale ranges from 2016 to 2022 for both speed and availability highlight the change in coverage and performance of broadband networks. On top of this there are options to filter by speed change which aggregates the broadband speed data, offering an insight into whether a local authority’s broadband speed fell or rose."

Who was the intended audience?
"The visualisation is aimed at all those interested in understanding the UK’s broadband inequalities, be it local media looking for potential news articles about broadband changes, the public looking for areas to move to, or policymakers looking to focus attention on the needs of specific regions."
How did you use the data, what methods and techniques?
"The broadband availability information is typically released every quarter and the broadband speed information each year, in CSV format, which are relatively straightforward to map. However, the datasets are published at postcode level, but full postcode boundaries are not open data in the UK. To overcome this, we aggregated the postcode data to output areas (OA), which are published as open data by the Office for National Statistics Postcode Directory and calculated the mean values.
"The OA data were joined with the spatial data, also from the ONS, to create choropleths of the broadband speed and availability. We then used QGIS to clip the choropleths to generalised urban areas. These are obtained from Ordnance Survey Strategi, the ONS’s Built Up Area geographies, OpenStreetMap via Geofabrik, and Ordnance Survey’s Vector Map District, depending on area, availability, time period and spatial scale.
"Carto’s data platform, overlaid on PostgreSQL (with PostGIS extensions), is used to host the data and quickly generate vector tiles, which are loaded into the map code when you visit Mapmaker."
Why did you choose to present the data in this way over other approaches?
"A map is a more accessible way to view the data, than in tabular format. By producing maps of the data, it allows local characteristics of the data to be immediately apparent, trends and patterns can be visualised in a clearer way. Our maps can be placed directly in reports and media articles, and the chosen colour ramps make the trends and discrepancies clear.
"The extract, transform and load (ETL) data integration approach to mapping that we take for the broadband maps, and similar mapping projects at CDRC, offers a way to combine data from multiple systems into a single database.
"There is potential to move to a more automated process, linking straight from the data provider’s site to Carto, or another web mapping provider, rather than taking it offline to prepare our interpretation of it. However, the current process has the benefit of stepping through the data with a cartographer and storyteller’s eye, allowing the resulting map to produce eye-catching visuals.
"If we were to move the sources of data, as well as the target databases to the cloud, fully automating the pipeline, we would need to be careful to retain these qualities."
What impact has the visualisation had in research, policy or other contexts?
"The broadband availability mapping has been included in several local neighbourhood plans, and in academic research, such as in inequalities of online groceries provision. Our curated copy of the Ofcom data used in the maps has led to other derived CDRC-produced data products such as the Internet User Classification, which has seen significant interest across the social science space in the UK."
How else might this approach or data be used? How can the visualisation be taken a step further?
"There is considerable scope for more development particularly because the Ofcom data has many variables available, and CDRC only maps two of them: average wired speed and availability of ultra-fast broadband (300Mbps+), typically needed for high-intensity media creation and consumption.
"A more sophisticated mapping solution for the data would allow the user to investigate the data further, for example, there may be considerable differences between residential and business broadband provision in the same area.
"Mobile-based broadband may also be useful to map, as non-fixed-line usage of internet services by consumers has soared since 2016, and indeed was well used even back then."
About the author
Oliver O’Brien is a Senior Research Associate at University College London (UCL) currently based at the Department of Geography, in the Geospatial Analytics and Computing Research Group (GSAC) and forming part of the ESRC Consumer Data Research Centre (CDRC).
You can find out more about Oliver and his work on his website.